Weekly MOTR Report (WMR): “Risk-On Small Caps Betting on Rate Cut.”

Highlights

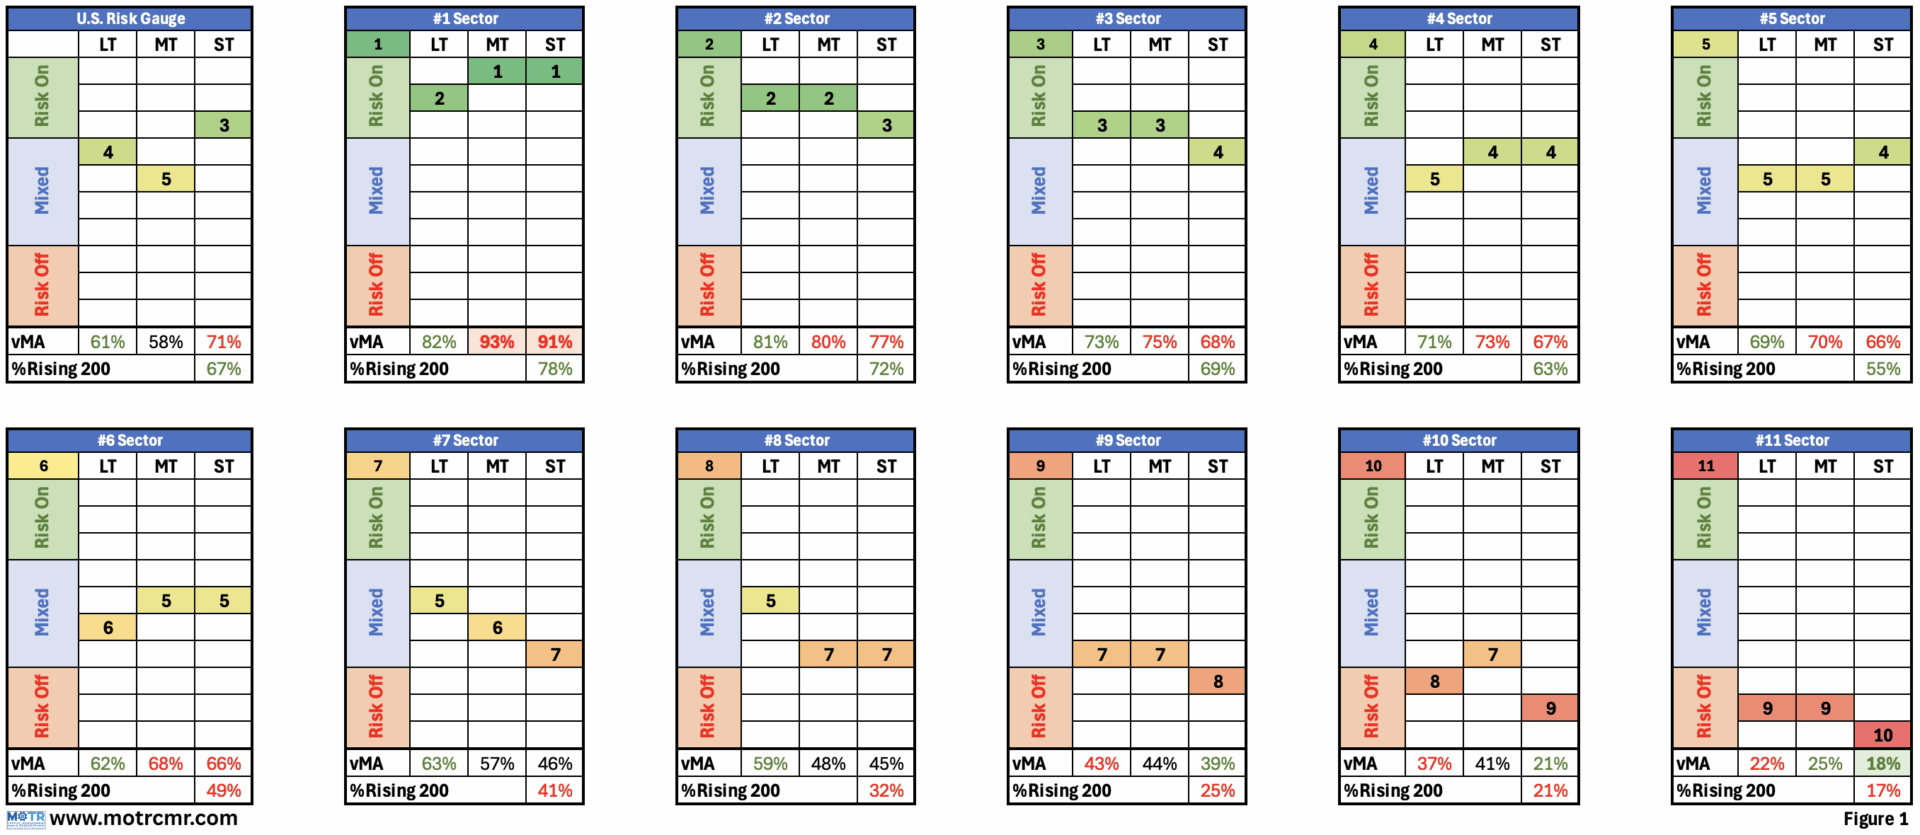
  • While many internal factors have been pointing more and more toward “Risk On” at the margin, small caps have seemed hesitant to endorse that view.
  • However, more recently, we have begun to notice a clear rotation towards riskier stocks within the small cap indices.
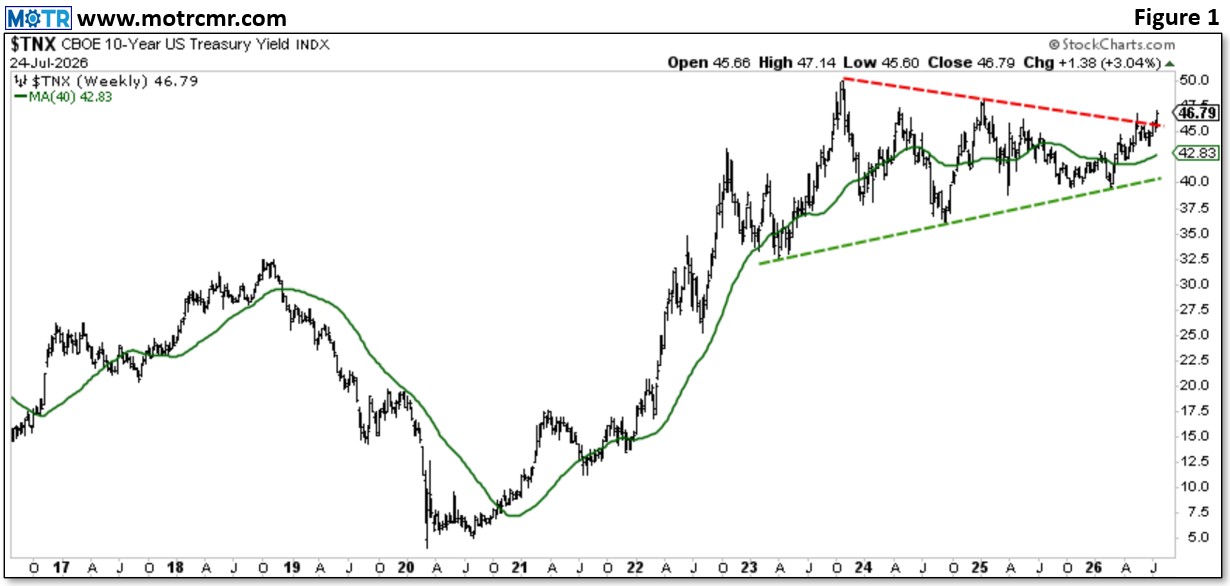
  • Recent shifts in this relationship have led trend changes in the 2-year note yield, which in turn have led changes in Fed policy.
  • We remain of the mind that in time, the mega caps will be great absolute shorts (several have already been great relative shorts), but long small caps against that trade may actually make absolute dollars.
  • There is precedent to this scenario…read on.

“Risk-On Small Caps Betting on Rate Cut.”

WMR 250915 Fig1 - MOTR Capital Management & ResearchLet’s start with MOTR’s official expectations for Fed policy this week: we have none. There are enough market participants out there getting it completely wrong, including Fed officials themselves, so the last thing we need is another voice contributing to the noise. Instead, we prefer to focus exclusively on the only voice that matters, which is of course that of the market itself.

In that regard, the market seems to be speaking loud and clear: several rate cuts are forthcoming. We already could glean that from the market’s resilience in the short-term, where conditions remain strong and stable, while long-term conditions are good and getting better. In particular, sector, group and industry leadership continues to tilt more and more towards “Risk On”.

One factor that has resisted endorsing an “easy Fed” outlook has been small caps. After briefly leading off the April lows, small caps have pulled in line with large caps, signaling no strong view either way. However, within small caps, we are beginning to see a clear rotation towards risker stocks, a clear indication that the market expects the Fed to act assertively.

Figure 1 shows the S&P 600 Small Cap ETF (SPSM) relative to the Russell 2000 Small Cap ETF (IWM) in the top panel. Pre-COIVD, we can see how these two small cap indices traded almost in lockstep with one another (blue box), just as one would expect. However, as COVID increasingly began to spread, causing the Fed to accelerate their easing program already underway (green line, lower panel), the SPSM began to materially underperform the IWM (falling red line in first green box). Why would that be?

WMR 250915 Fig2 - MOTR Capital Management & ResearchFigure 2 sheds considerable light on this matter. Here, we compare the qualitative aspects of the SPSM and the IWM and include similar stats for the S&P 500 ETF (SPY) and the iShares Microcap ETF (IWC) for further comparison. There is a lot of information here worth pondering at your leisure, but for now, we’ll draw your attention to a few standout stats.

First, 10% of SPSM stock prices are below $10, whereas 28% of IWM are sub-$10 (row 4). This is one of the many stats highlighting the difference in quality in the constituents composing each ETF. Another is “%Profitable” (row 30): 77% of SPSM stocks turn a profit, while only 65% are in the green in the IWM. Indeed, the average Return on Invested Capital (ROIC) is positive for the SPSM and negative for the IWM (row 31).

In essence, stocks in the IWM are smaller (rows 4 & 10) and less profitable (rows 23, 30 and 31) than those in the SPSM, making them more levered to lower interest rates. Note how the higher quality SPSM began to outperform the IWM well before the Fed began rapidly raising rates (right side of first green box), then more recently began to underperform the IWM (middle of red box) well before the Fed began its latest rate cutting cycle.

In prior WMRs, we have suggested that if you wanted to know what the Fed was going to do next, just look at the 2-year note yield (Figure 1, blue line in lower panel). For all their hemming and hawing, in the end, the Fed seems to conform to the wisdom of the market, adhering to trends in the 2yr yield. For now, at least, it would seem we have another metric providing insight into future Fed moves, one that seems to lead even the 2yr note itself.

WMR 250915 Fig3b - MOTR Capital Management & ResearchFinally, Figure 3 shows the S&P 600 (top panel) relative to the S&P 500 (lower panel) since 1996. That lower panel should be a rude awakening for anyone who believes large cap stocks outperform at all times. From 1996 to early 1999, large caps truly did rule the roost, but if you take out your magnifying glass, you’ll note that small caps began to outperform large caps at the tail end of the ’99 bubble, marking the end of large cap dominance and 20 years of subsequent small-cap outperformance (green arrow, lower panel).

More than that, small caps actually hit new all-time highs in 2002 (blue arrow, upper panel), after the S&P peaked in 2000. With brief pauses along the way, small caps stacked up wins against large caps despite several “risk-off” moments, such as the 911 terrorist attack, the ’02 bear market, the GFC, and the Euro Debt Crisis.

It wasn’t until the severe economic disruption brought on by COVID when small caps handed back the crown to large caps (second red arrow, lower panel). The Risk Gauge inset in Figure 3 is for the fifth quintile of market cap (the smallest) in the MOTR Universe. While much progress has been made in the short- and medium-terms, the long-term is still “Risk Off”.

While this reveals that the smallest market cap stocks are still digging through the rubble post the ’22 bear and the SIVB bank failure of ’23, this is also a double-edged sword. If the Fed does indeed step on the gas, the still broken structure in the higher timeframes represents latent potential, should those charts be repaired in coming months. This could tilt the scales back in favor of small caps at a time when large and mega caps have reached nosebleed valuations (Figure 2, rows 17-22) on already strong earnings. Granted, small and micro caps are no not inexpensive themselves, but the case can be made that those valuations are on very depressed earnings trends, in place since the ’22 peak.

As shown between ’00-’02, the top in large-caps back then did not drag the small caps down for some time…we are very open to this outcome. Almost a hedge fund nirvana…long small caps against large & mega cap shorts.

Signature - MOTR Capital Management & Research

Back To Top