Highlights
- The “K-Shaped” economy has resulted in a “K-Shaped” market with no signs of relief in sight.
- Within the tech sector alone, the dispersion between leading Semis and IT Hardware vs lagging Software & Services has never been so wide.
- Outside of Tech, other traditionally pro risk groups, like Consumer Durables, Retail, Capital Markets, and Credit & Credit Services are being decimated, while Capital Goods, Clean Energy, Energy, and Materials perform admirably.
- While this is indeed very unorthodox, it is what it is…bullish and bearish simultaneously, and we continue to engage accordingly, long leaders and short laggards.
“K-Shaped Economy and Markets.”
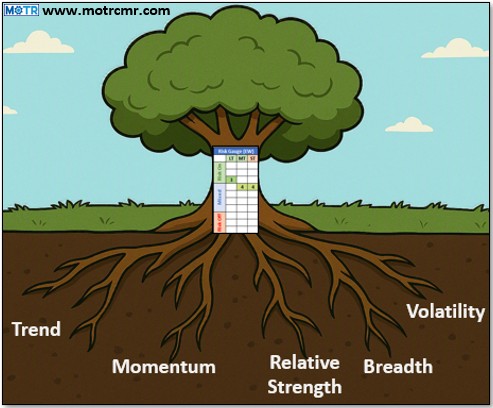
: \"K-Shaped Economy and Markets.\" 6") The very much discussed “K-Shaped” economy has resulted in a “K-Shaped” market as well. Despite the market’s strong showing at the index level, dispersion remains high beneath the surface. This is more than evidenced by the Risk Gauge’s inability to obtain Risk On since late 2021. Indeed, just over 40% of the stocks in the MOTR Universe are still below their respective 2021 peak. This condition hasn’t prevented us from embracing risk, but it has encouraged us to engage tactical short exposure when the opportunity is presented.
The very much discussed “K-Shaped” economy has resulted in a “K-Shaped” market as well. Despite the market’s strong showing at the index level, dispersion remains high beneath the surface. This is more than evidenced by the Risk Gauge’s inability to obtain Risk On since late 2021. Indeed, just over 40% of the stocks in the MOTR Universe are still below their respective 2021 peak. This condition hasn’t prevented us from embracing risk, but it has encouraged us to engage tactical short exposure when the opportunity is presented.
The Tech sector has been a standout leader since the 2022 bottom. However, even with that leading sector, dispersion has been “off the charts”. Figure 1 shows the performance of the equally weighted Tech sector ETF (RSPT) relative to the equally weighted S&P ETF (RSP), currently in a near vertical run into new high territory. The lower panel shows how far the trend is from its 40-week moving average, and by this measure, this relationship has never been as extreme in its more than 20-year history.
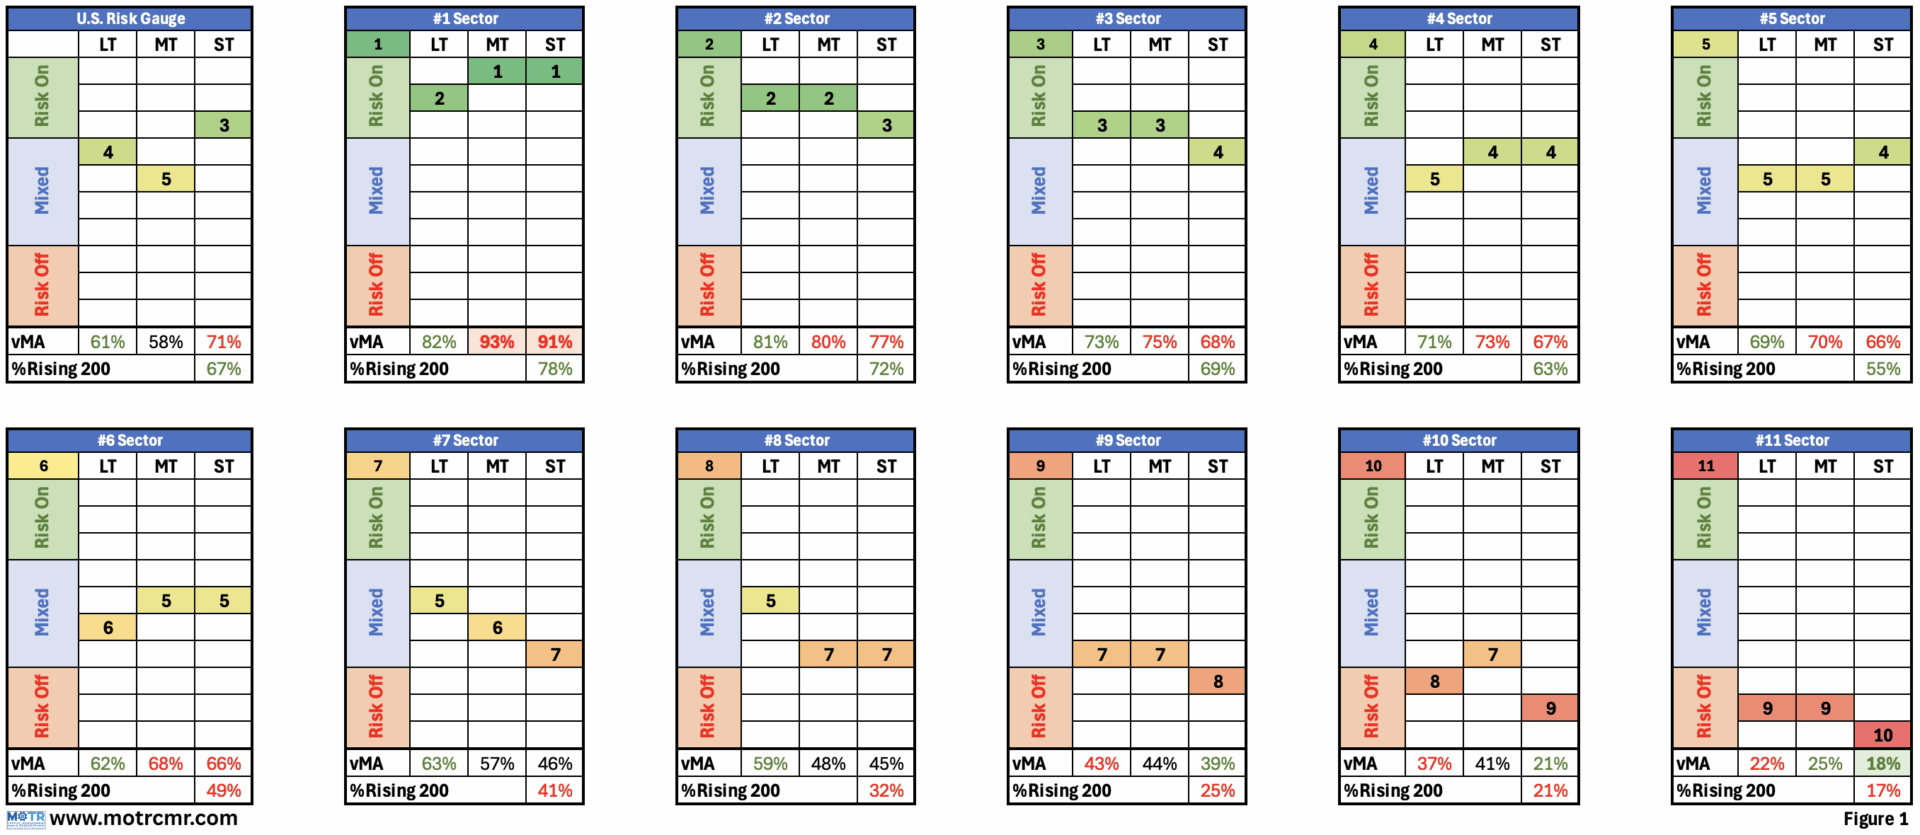
: \"K-Shaped Economy and Markets.\" 7") Despite this strong showing, Figure 2 reminds us that all is not well within this leading sector. Here we see the MOTR Industries within the tech sector sorted by their long-term MO score. Within the two leading MOTR Groups–Semis and IT Hardware (left side of table)–all but 2 industries host a MO score better than 50, with all industry VST scores better than 50. This depicts a very strong, unified message of strength within these groups, and investors should be long these two groups.
Despite this strong showing, Figure 2 reminds us that all is not well within this leading sector. Here we see the MOTR Industries within the tech sector sorted by their long-term MO score. Within the two leading MOTR Groups–Semis and IT Hardware (left side of table)–all but 2 industries host a MO score better than 50, with all industry VST scores better than 50. This depicts a very strong, unified message of strength within these groups, and investors should be long these two groups.
On the other hand, at the bottom of this “best-to-worst” table, we see the many industries from the Software & Services Group. Every one of them has a MO score worse than 50, with only one industry–Software-Design–better than 50. Within the same otherwise typically pro-risk, growthy tech sector, we have two groups dominating the leaderboard, while the third could not be ranked worse. The lack of repair work here indicates that the group is not poised for leadership any time soon.
Outside of Tech, we see the “K-Shaped” market is in effect broadly across the otherwise typically pro risk Consumer sector. Figure 3 shows the equally weighted relative strength of the sector, which peaked as far back as 2015, and is flirting with new lows as far back as 2009. While not as extreme as it has ever been (lower panel), it is indeed quite extended in its current trend.
: \"K-Shaped Economy and Markets.\" 8") Similar to the Tech sector, the Consumer sector is broken down into three MOTR Groups (Figure 4), but the overall picture is far more grim. Here, all three Consumer MOTR Groups are in the bottom half of the ranking, with the vast majority of Consumer MOTR Industries in the lower half of the ranks. Indeed, Homebuilders, Big-Ticket Items, and Retail, which collectively contribute a significant amount to GDP, have been and remain in the dumps.
Similar to the Tech sector, the Consumer sector is broken down into three MOTR Groups (Figure 4), but the overall picture is far more grim. Here, all three Consumer MOTR Groups are in the bottom half of the ranking, with the vast majority of Consumer MOTR Industries in the lower half of the ranks. Indeed, Homebuilders, Big-Ticket Items, and Retail, which collectively contribute a significant amount to GDP, have been and remain in the dumps.
: \"K-Shaped Economy and Markets.\" 9") The most important point in all of this, and what makes this environment so unique, is that this underperformance is driven by absolute price downtrends. Ordinarily, were this a truly healthy bull market, that underperformance would stem from these cyclical groups going up less than the rest of the market. Instead, underperformance has been in the form of negative price trends, which serves to open a very wide gap between leaders and laggards.
The most important point in all of this, and what makes this environment so unique, is that this underperformance is driven by absolute price downtrends. Ordinarily, were this a truly healthy bull market, that underperformance would stem from these cyclical groups going up less than the rest of the market. Instead, underperformance has been in the form of negative price trends, which serves to open a very wide gap between leaders and laggards.
We stress again that this is not bearish; we should be long the leadership. But it does mean that we should also be selectively shorting the laggards when opportunities present themselves. It also means that when the leadership finally gives it up, we are likely looking at a pretty messy bear market. How bad will depend on how good the bull is beforehand, and we still think it’s got further to run.
: \"K-Shaped Economy and Markets.\" 10")