
Charting My Interruption (CMI): “Tension Resolved, Which May be a Bad Thing.”
Highlights Through the lens of our process, all that has changed after two days of strength is that we have
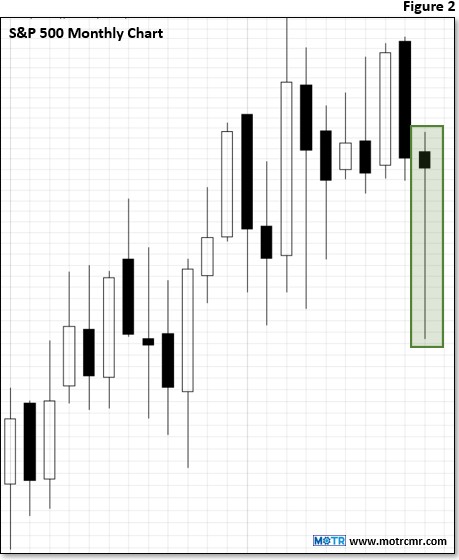
Charting My Interruption (CMI): “Still Technically Broken Despite Rally.”
Highlights After rallying over 13% from recent lows, the S&P has settled in with a more than 11% gain since
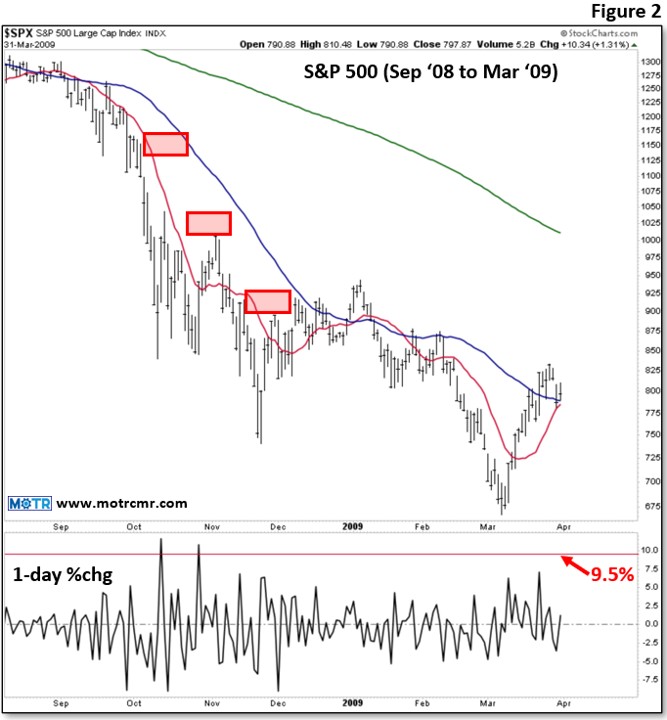
Charting My Interruption (CMI): “Full of Sound and Fury, Signifying Nothing.”
Highlights Despite all the noise, yesterday's rally was more symptomatic of a near death patient convulsing on an operating table
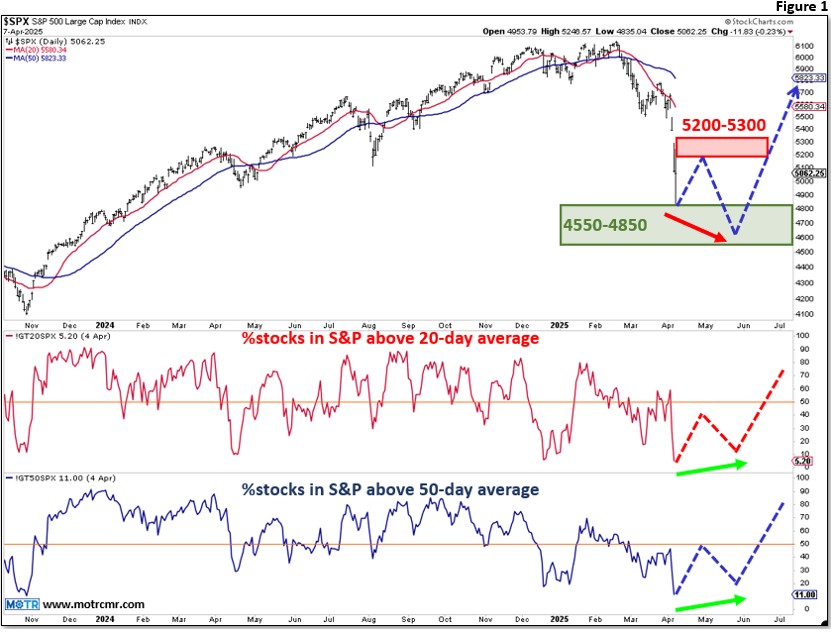
Charting My Interruption (CMI): “What a Market Bottom Might Look Like.”
Highlights With volatility spiking and markets under pressure, the two most frequent questions we receive are "how low will this
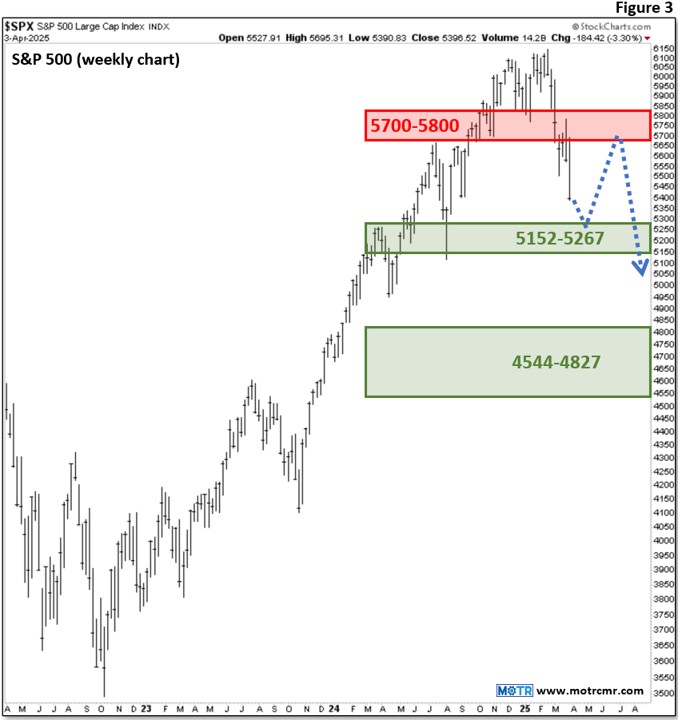
Charting My Interruption (CMI): “Key Support Broken, Fortifying Bear Case.”
Highlights The key 550 support for the S&P 500 ETF (SPY) we highlighted in last week's webinar (here) was gapped

Charting My Interruption (CMI): “Up is Good, but Only if Up ‘Does’ Good.”
Highlights Cyclical sectors are very oversold, reflecting investor angst with respect to today's impending tariff announcement. Our view is that,
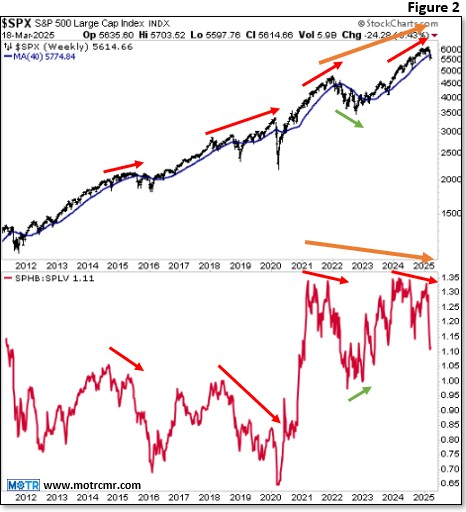
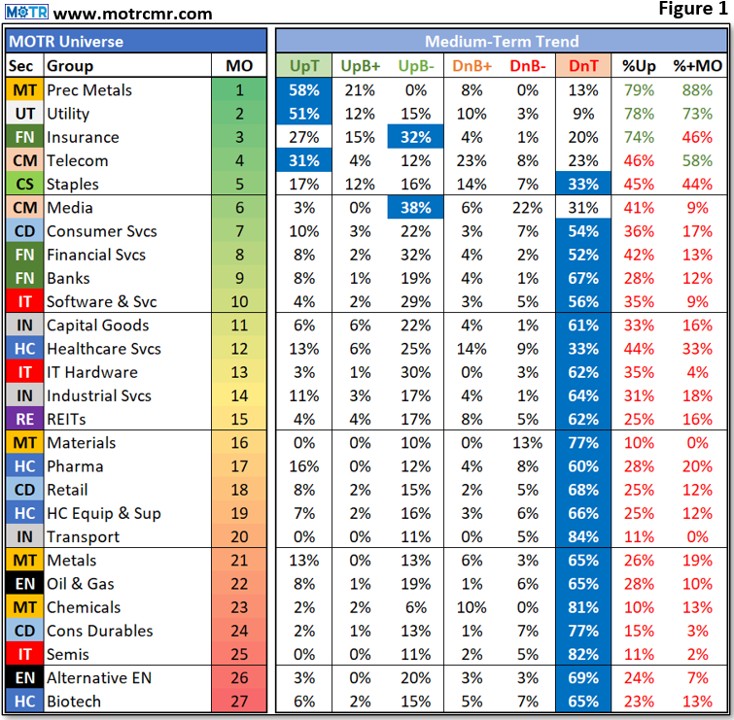
Charting My Interruption (CMI): “Not the Leadership I Want to Follow.”
Headlines Bull markets are generally led by cyclical groups, as investors confidently lean into 'risk on' allocations. Bear markets are
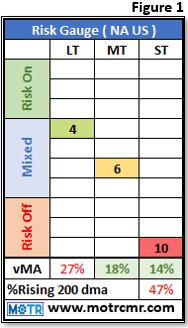
Charting My Interruption (CMI): “Next Up…Overbought Downtrend.”
Highlights The mudslide off the highs has cut through supports like a hot knife through butter, ignoring very oversold conditions

Charting My Interruption (CMI): “My Hindsight Portfolio is Killing it!”
Highlights If our call pans out for the S&P to rally to 6000 before much lower prices later in the

Charting My Interruption (CMI): “Stocks and Bonds Back to Uncorrelated???”
Highlights Quietly, bond and stock prices have become uncorrelated once again, today being a good example. Ironically, as most have

Charting My Interruption (CMI): “Bullish Implications ‘Sandwiched’ into Today’s Reversal.”
Highlights The painful knuckle sandwich delivered by the bears today resulted in a sandwich of a different type being traced

Charting My Interruption (CMI): “Lower 10-year Treasury Yields From Here.”
Highlights While most investors seem to be concerned about higher rates and what that will do to stocks, we have