
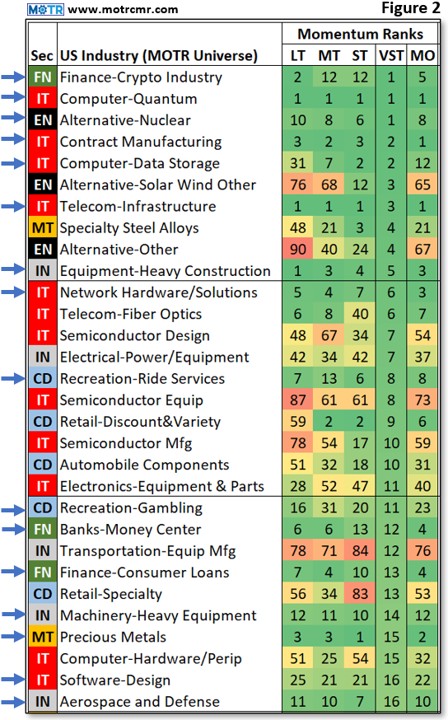
Charting My Interruption (CMI): “Some Stock Ideas: Focusing on Leaders Leading.”
Highlights Short-term (weekly) improvements continue to build off the April lows and are now finally spilling over into the all-important
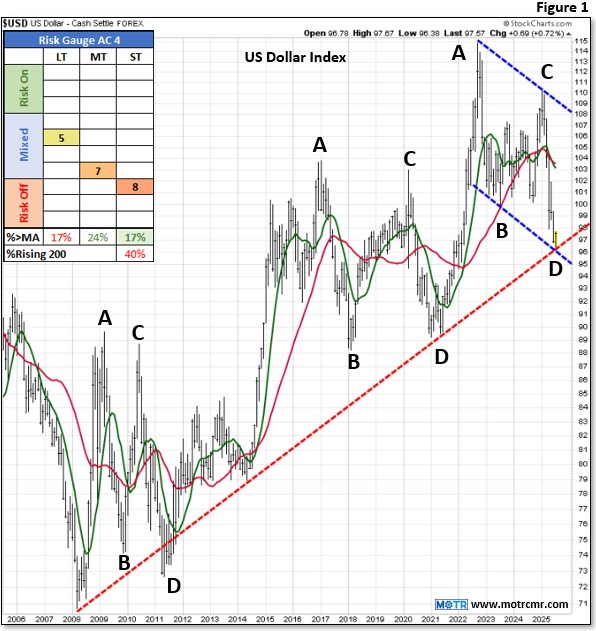
Charting My Interruption (CMI): “US Dollar Bounce in the Cards.”
Highlights The USD has been weak of late, but we think the groundwork has been laid for a mean-reversion trade
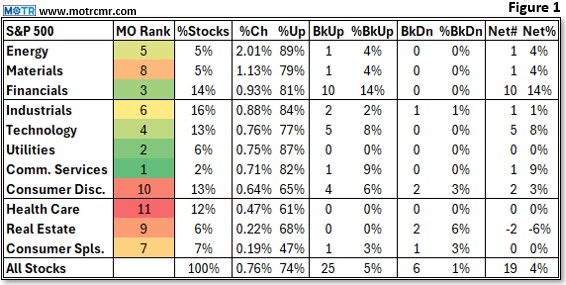
Charting My Interruption (CMI): “The MOTR Filter Shows Few Breakouts.”
Highlights The S&P has approached its all-time highs, but breadth suggests that the index might be lonely at the top.
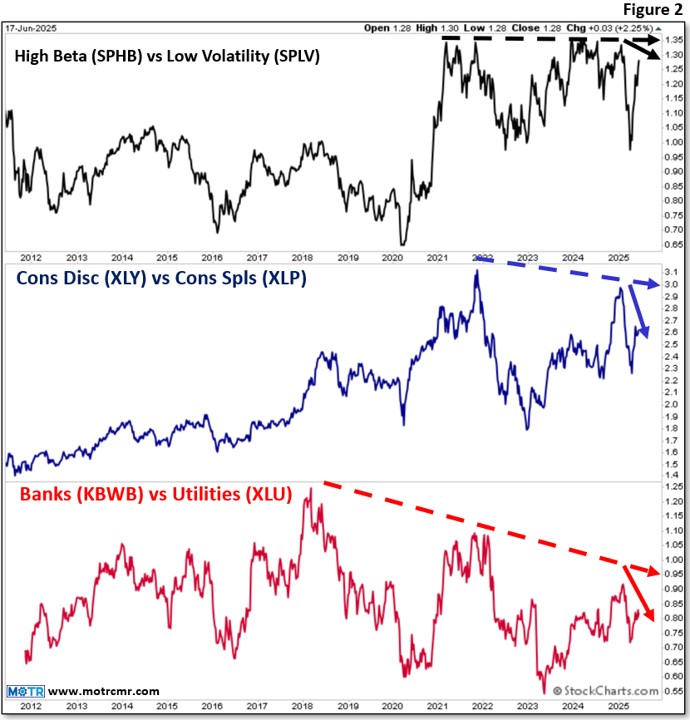
Charting My Interruption (CMI): “Don’t Confuse Beta with Resilience”
Highlights If the S&P rallies more than 20%, the easy bet would be that high beta would outperform low beta...beta
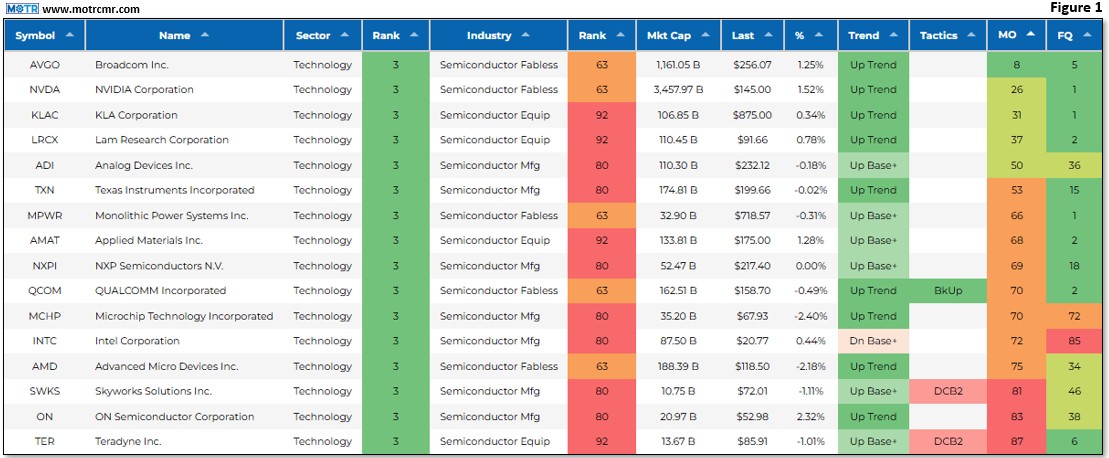
Charting My Interruption (CMI): “Semiconductors at Important Juncture.”
Highlights Not only are the popular averages at a critical juncture, but so too is the MOTR Semi Group. Ranking
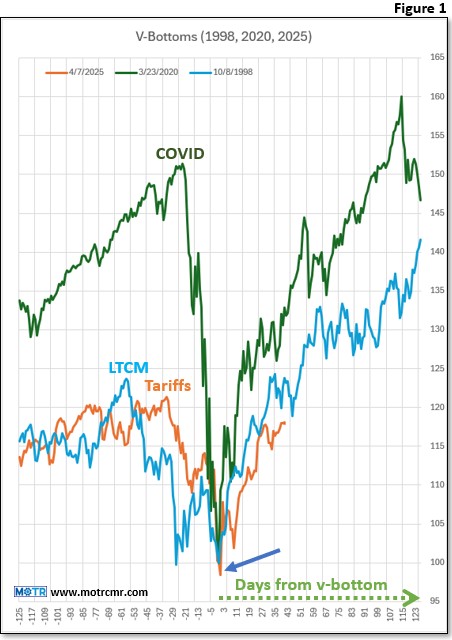
Charting My Interruption (CMI): “Wait for it…Wait for it!!!”
Notice I will be celebrating my daughter's wedding this weekend and will therefore not be writing a Weekly MOTR Report,
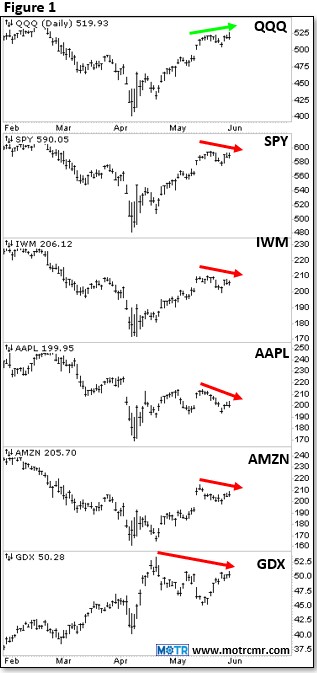
Charting My Interruption (CMI): “Stocks Top on Good News, Not Bad.”
Highlights It is never the specific news item, nor how we feel about it personally that matters...rather, it is how
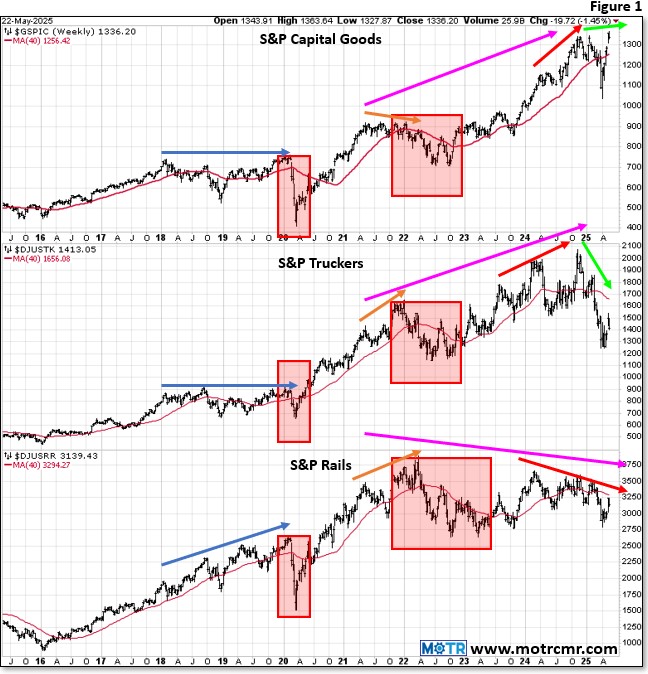
Charting My Interruption (CMI): “Dow Theory Sell Signals Continue to Build.”
Highlights In today's CMI, we offer a brief primer on Dow Theory, along with a more nuanced version of that

Charting My Interruption (CMI): “Non-US Equities on the Comeback Trail.”
Highlights While the US remains "Mixed", equities ex-US continue to show standout resilience. We expect that a year from now,
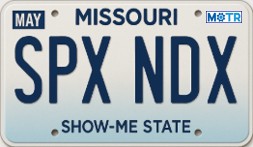
Charting My Interruption (CMI): “We’re in the ‘Show Me’ State of Missouri.”
Highlights As the Missouri license plate suggests, we are in the "Show Me" state, patiently waiting to see how the

Charting My Interruption (CMI): “FOMO And Our Little Rat Brains.”
Highlights Even after today's rally, market structure clings to "Mixed" at best, leaving us with no choice other than to

Charting My Interruption (CMI): “Zweig Breadth Thrust, the ‘Slope of Hope’, and the Risk Gauge.”
Highlights The recent Zweig Breadth Thrust (ZBT) has lit a flame of hope that the worst is behind us, further