Charting My Interruption (CMI)

Charting My Interruption (CMI): “Two Opposed Ideas, One Action Plan.”
Highlights The market continues to flash major divergences, with the S&P near all-time highs, making the ability...
Charting My Interruption (CMI): “Getting Oversold.”
Highlights Our process leads us to a tactical exposure that is roughly balanced between longs and shorts, reflecting...
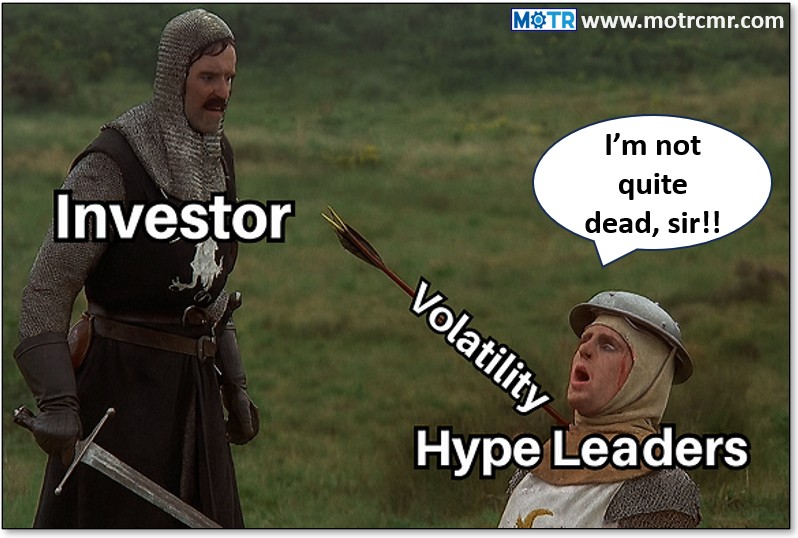
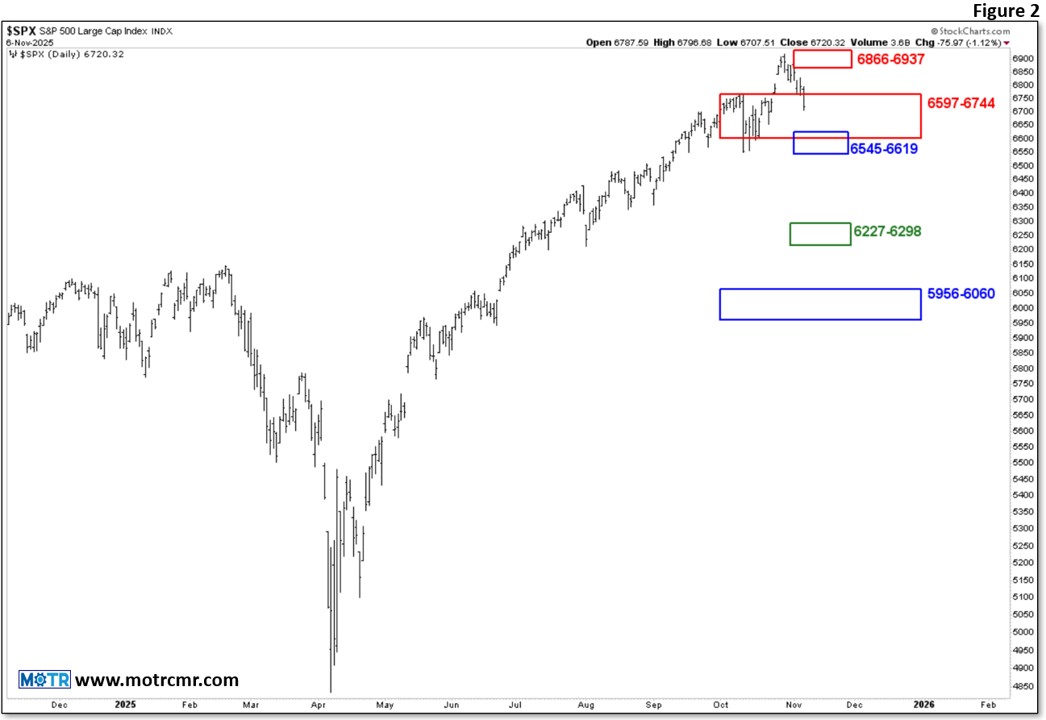
Charting My Interruption (CMI): “I’m Not Quite Dead, Sir!”
Highlights With the S&P floundering inside its overlapping projected monthly and quarterly resistance zones, it...

Charting My Interruption (CMI): “The Risk Gauge Downticks; Now What?”
Highlights As our 'new era' MOTR Industries dominate the market leaderboard, we note that the equally weighted Risk...

Charting My Interruption (CMI): “S&P Investment Committee Chasing Tech.”
Highlights Since November 2022, the S&P 500 has become increasingly more concentrated in Technology, now at its...
Charting My Interruption (CMI): “Only in a Bubble.”
Highlights Cooling PPI and core PPI give more signals that the Fed will likely cut rates next week, and lower treasury...

Charting My Interruption (CMI): “Zoning in on NVDA.”
Highlights NVDA reports earnings today at approximately 4:30 PM EST, with the entire market watching closely. ...

Charting My Interruption (CMI): “Digging through the ‘Trash’ for Ideas.”
Highlights "One man's trash is another man's treasure" is a timeless saying that emphasizes the value that can be...

Charting My Interruption (CMI): “The Dr. Jekyll & Mr. Hyde Market.”
Highlights We remain of the mind that this is a Dr. Jekyll and Mr. Hyde market. For every good chart (Dr. Jekyll), we...
Charting My Interruption (CMI): “Innovative Growth Leads Positive Change at the Margin.”
Highlights Change at the margin continues to support a constructive tactical view towards the markets, and an active...

Charting My Interruption (CMI): “All Good…For Now.” (video)
"All Good...For Now." (video) In this CMI, we thought we'd try something a little different, using a video to walk...
Charting My Interruption (CMI): “Some Stock Ideas: Focusing on Leaders Leading.”
Highlights Short-term (weekly) improvements continue to build off the April lows and are now finally spilling over into...