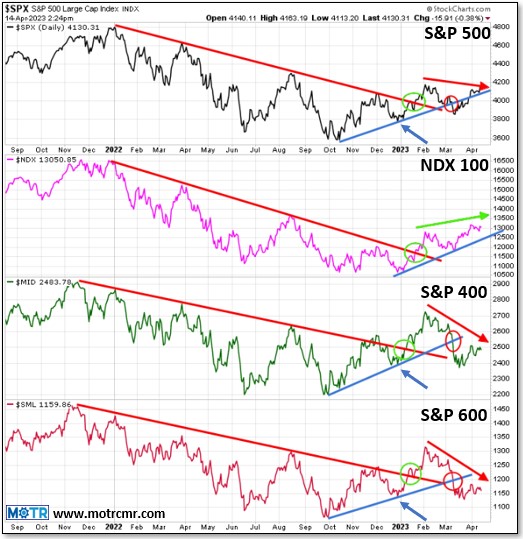
 The recent weakness in the three major S&P averages--500 large cap, 400 mid cap, and 600 small cap--was adequate enough to force all three averages to break their short-term uptrends off their October lows (see red arrows/circles in chart). Unless you have been hiding under a rock (these days, who's to blame you!), you know that the sell-off was caused by the. . .