
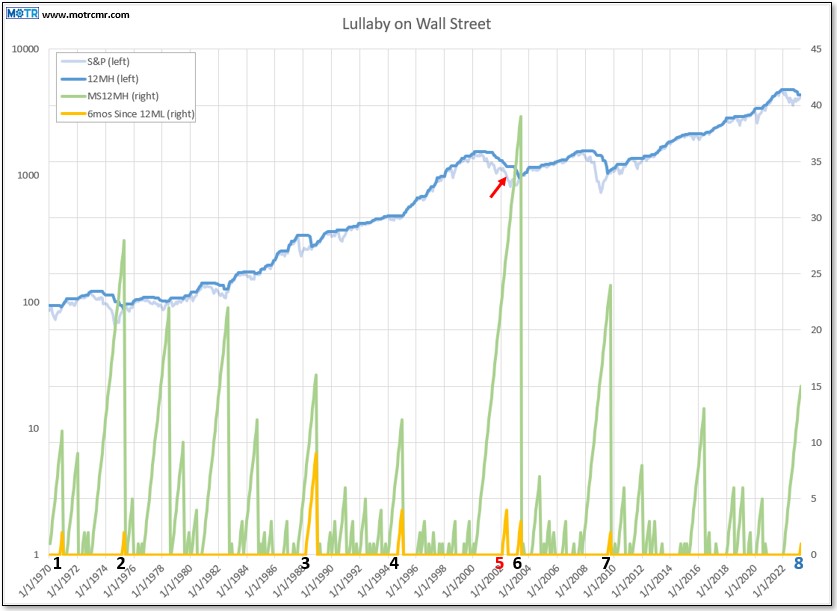
 Its been 15 months since the S&P has hit a 12 month high. While this is clearly not good for the bulls, such lack of upward progress isn't necessarily good for the bears, either. The current case is a good example, in that it has also been 6 months since the S&P has hit a 12 month
Charting My Interruption (CMI): “Lullaby on Wall Street”
April 21st, 2023

Related Market Insights
Some of Our Latest Commentary
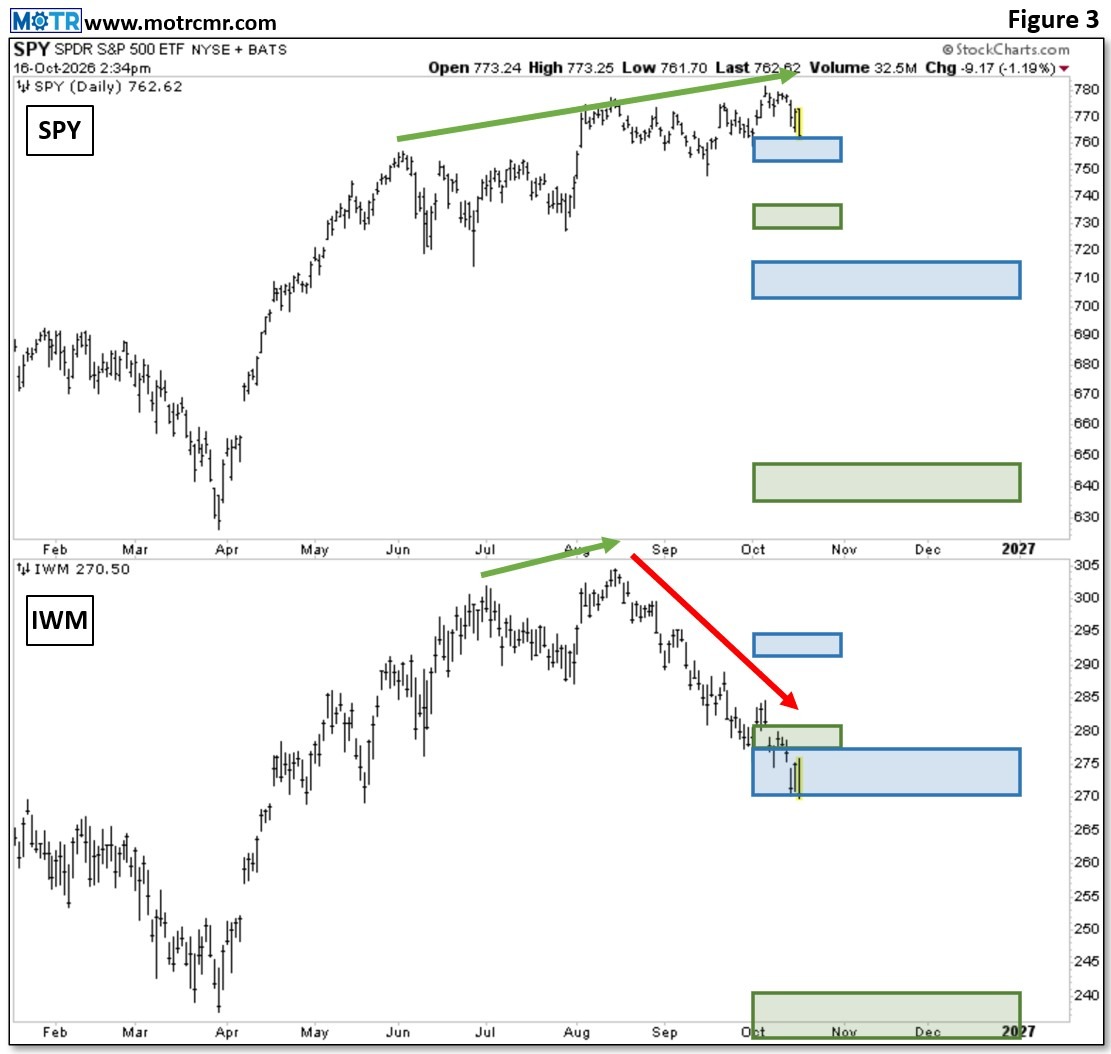
Charting My Interruption (CMI): “Too Late for Bulls, too Early for Bears.”
Highlights We have been closely monitoring the quality of market action as the S&P scores new highs, and we don't
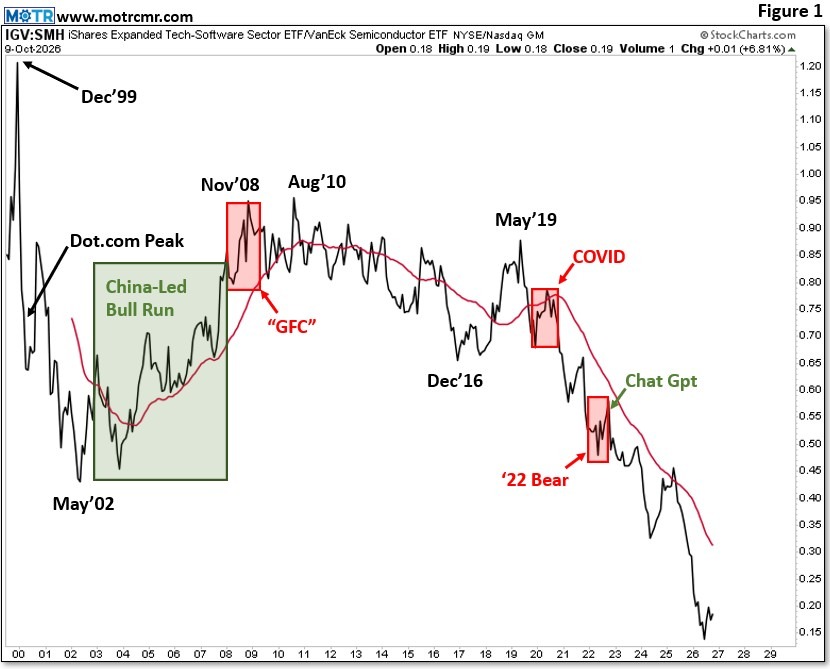
Weekly MOTR Report (WMR): “Don’t Look Now, but Software is Back!!””
Highlights Software is re-emerging as a leadership theme after years of severe underperformance versus semiconductors, a trend that actually began
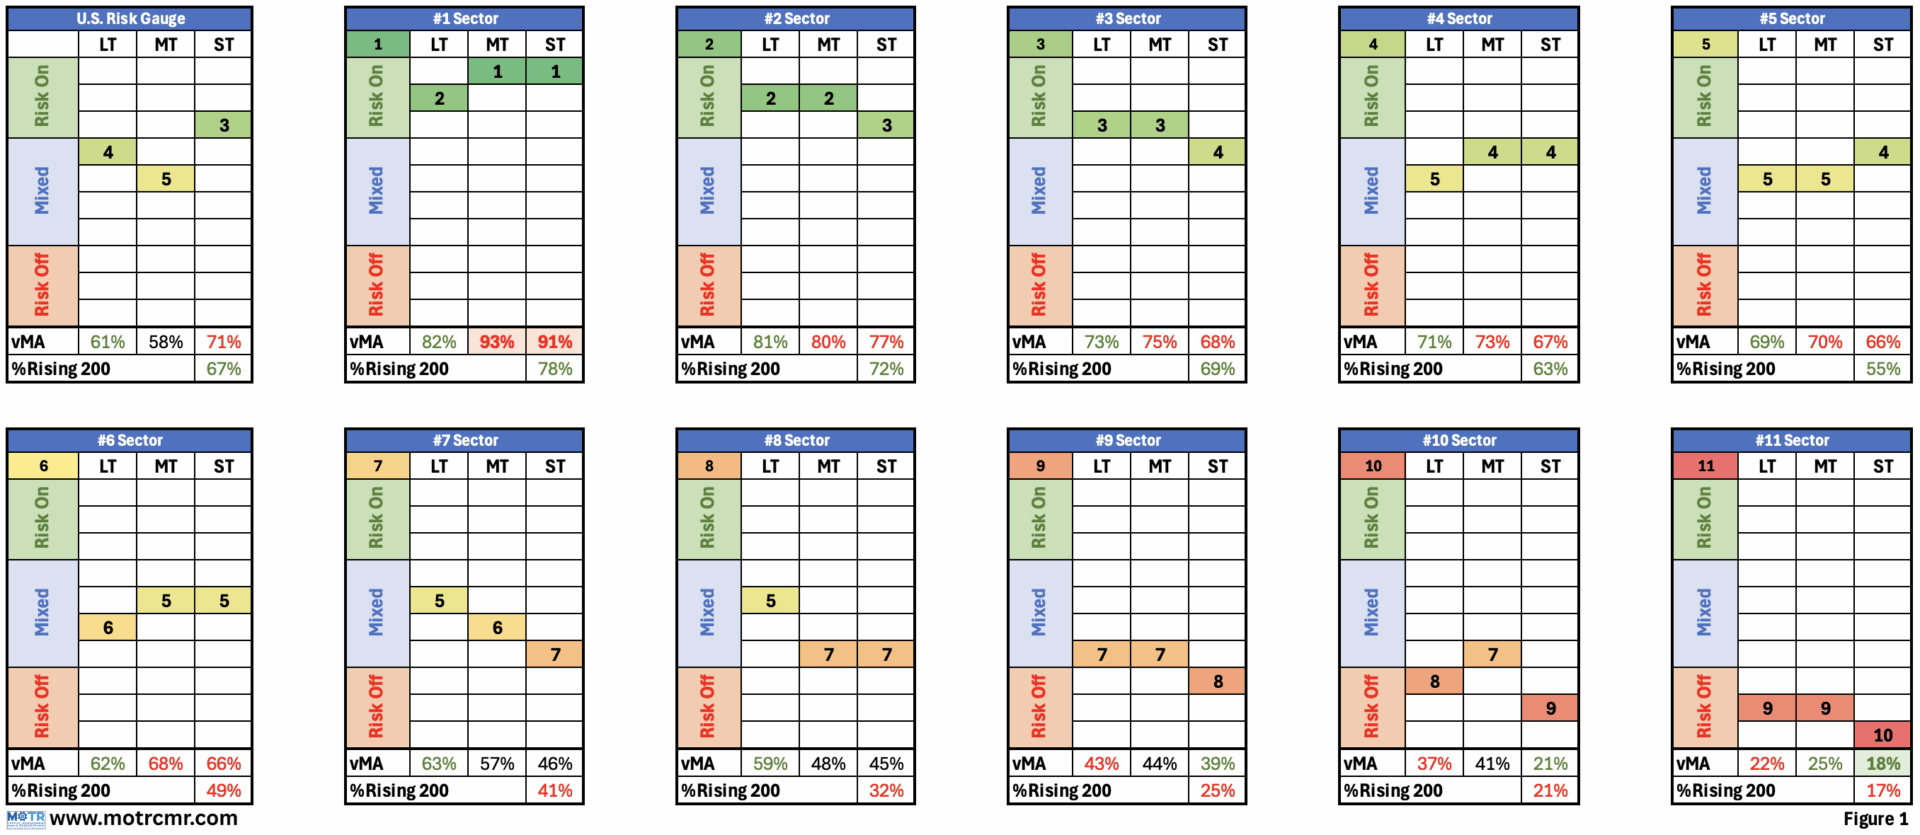
Weekly Risk Gauge (WRG): “Focusing on Change at the Margin.”
Highlights The U.S. Risk Gauge remains oversold, with the ST timeframe in
Charting My Interruption (CMI): “Bullish for Q4, but Head on a Swivel.”
Highlights Market internals are deceptively oversold, setting the stage for a strong Q4'26 seasonal window. We are more than 100%
Weekly MOTR Report (WMR): “Oversold Breadth Bullish for Now.”
Highlights Despite the S&P being essentially at all-time highs, most stocks are down high single/low double digits. This oversold breadth
Weekly Risk Gauge (WRG): “Technology First to Emerge.”
Highlights The LT gauge remains in 'Risk On' while the MT gauge closed in the top half of 'Mixed', creating